Member-only story
Summary of September 2021 using IntoTheBlock On-chain Cryptocurrency Analytics
5 Key analytics to provide an on-chain overview of the cryptocurrency market in September

Wake me up when September ends, used to sing the Green Day.
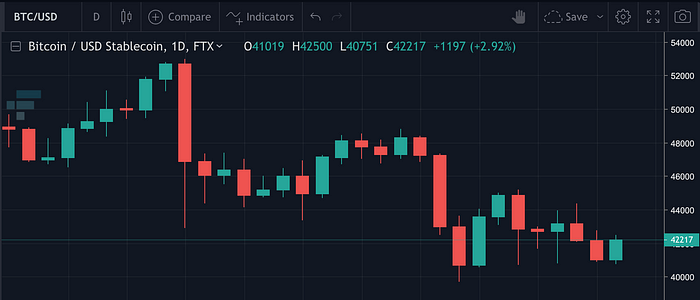
Nowadays, this is probably the same motto in the heads of most cryptocurrency users, given September’s steep drop in the value of most cryptocurrencies, exemplified by the Bitcoin daily price chart below.

Nothing new though, as September has historically been a negative month for cryptocurrencies, printing a lower price than the previous months 4 times out of the last 4 years.

This is mostly the result of:
1. Regulatory concerns about cryptocurrencies (e.g. Binance stopping service in Singapore, Coinbase, and the SEC scrutiny) but especially
2. Major macro uncertainty about the global economy as a result of the risk of a default of Evergrande, China’s biggest real estate company, which now sits on more than $300 billion in debt. Coupled with rising global inflation and the FED hinting about reversing its pandemic stimulus program, fuels fear uncertainty and doubt (FUD) about what’s to happen in the upcoming months.
IntoTheBlock analytics offer a glimpse behind the scenes, providing useful insights about cryptocurrencies using on-chain indicators.
Here are 5 of the key indicators for this month:
1. Price Performance: Correlation with Traditional Indices
Contrary to what most people believe (and hope) cryptocurrencies are still correlated to traditional markets.

The image below serves as an example of how cryptocurrencies (BTC and ETH in this case) were…

